Testing query performance under concurrent sessions

Since local development is a fake virtualization of production environment where only one user (developer) is interacting with whole system, it can conceal the real disaster: scenario like system downtime in production. Therefore, I wanted to test the performance of the most important yet heaviest query of my current working project under 100 concurrent users.
The problem set
- Mocking concurrent sessions
- Logging query failures
- Preparing substitute data set
1. Concurrent sessions
I used connection per thread to create different sessions to operate the queries in a non-blocking way. So, I implemented the class below to encapsulate some information including thread identifier, the thread itself, and the result-counter instance. It will log whether the query succeeded or not, also the total elapsed time in seconds after the execution.
public class SessionThread
{
//fields removed for brevity
public SessionThread(int threadId, ResultCounter counter)
{
this.threadId = threadId;
this.thread = new Thread(DoWork);
this.counter = counter;
}
public void ExecQuery ()
{
thread.Start ();
}
private void DoWork ()
{
try
{
var task = QueryDb(GetDb());
task.Wait();
counter.Success();
}
catch (Exception e)
{
Console.WriteLine("Query {0} ended with error: {1}", threadId, e.Message);
counter.Failure();
}
}private EpcisContext GetDb()
{
var context = new EpcisContext(
new DbContextOptionsBuilder<EpcisContext>()
.UseNpgsql("Server=localhost; Database=epcis_dev; Port=5432; User Id=postgres;Password=Pass1234!")
.Options);
return context;
}private async Task QueryDb(EpcisContext context)
{
Stopwatch stopWatch = new Stopwatch();
stopWatch.Start();
var query = context.Events.AsNoTracking();
//All the querying stuff removed for simplicity
stopWatch.Stop();
// Get the elapsed time as a TimeSpan value.
TimeSpan ts = stopWatch.Elapsed;
Console.WriteLine("Query {0} complete. No of events: {1}.\n Query {2} elapsed: {3} seconds", threadId, res.Count, threadId, ts.TotalSeconds);
context.Dispose();
}
}
2. Logging query failures
Since the threads are scheduled back and forth asynchronously in CPU scheduler, it took some time to figure out logging how many of the queries failed or succeeded. You might have noticed the ResultCounter type in the code above. Yep, that’s the thing that stands for logging.
All threads share the same instance of ResultCounter class. Thus, they are using the middle state _failure, and _success to record the results.
public class ResultCounter
{
private int _failure;
private int _success; public void Failure()
{
_failure++;
Log();
}
public void Success()
{
_success++;
Log();
}
private void Log()
{
Console.WriteLine("Success count: {0}; Failure count: {1}", _success, _failure);
}
}
Putting it together the program looks like the code below.
public class Program {
private const int Sessions = 100;
public static void Main(){
var counter = new ResultCounter();
for (int i = 0; i < Sessions; i++)
{
var thread = new SessionThread(i, counter);
thread.ExecQuery();
}
}
}
Okay then, this is it. But we can’t query anything if there isn’t any data recorded right?
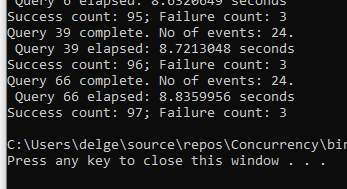
Giving the first try, I inserted 28 rows in my database table to try the querying. The program counts 97 successful operations but 3 of 100 failed (A transient failure). And the worst execution time is pretty slow 8.83 seconds.
3. Preparing substitute data set
But in a production scenario, the database won’t have simple 26 rows of records. It will count from thousands to millions, so I wanted to test that bulked size of information too. The solution is simple enough, creating another console app, obtaining database connection, inserting data in for loop, done. Do you think so? As I was dipping my hands into it, I found it also requires a neat solution to insert thousands of records into a database through entity framework.
Executing the implementation of the first simpler solution, loaded endlessly. But I don’t have that much time on my hands. After googling some practices, I found one.
private EpcisContext AddToContext<T>(EpcisContext context,
T entity, int count, int commitCount, bool recreateContext)
{
context.Add(entity);
if (count % commitCount == 0)
{
context.SaveChanges();
if (recreateContext)
{
context.Dispose();
context = TestContext.GetRealContext();
context.ChangeTracker.AutoDetectChangesEnabled = false;
}
}
return context;
}
The thing is the EF context is a scoped service that isn’t supposed to be long living. It is needed to insert data in chunks, dispose of and recreate the context. The ending code looks like below.
private void SeedData()
{
EpcisContext context = null;
try
{
context = TestContext.GetRealContext();
context.ChangeTracker.AutoDetectChangesEnabled = false;
for (int i = 0; i < 100000; i++)
{
var evt = new FasTnT.Domain.Model.Event()
{
//for brevity
};
context = AddToContext(context, evt, i, 1000, true);
}
context.SaveChanges();
}
finally
{
if (context != null) context.Dispose();
}
}
Having the hundred thousand rows inserted, let’s try the concurrent queries again.
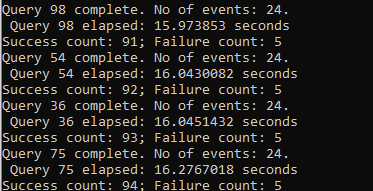
The worst execution time doubled. The success count is almost the same as the previous test. This log complains enough about the query performance. I better optimize it 😏.
Conclusion
In contrast to scaffolding the whole system, experimenting with query performance on a simple console application could be a good, rapid practice if we want more insights and understanding about our query.